In the last post I described my weekend project of using advice from Tiger Style to optimize the write path of Seb. Here, we found that data serialization and memory allocations were big contributors to the application being slower than it could be, and profiling helped us identify places on the write path where batching and buffer reuse could greatly improve the throughput. With a few small changes, we doubled the number of records that Seb can write to disk per second!
In this post we’re going to use those learnings as a guide to do the same thing on the read path. In order for the posts not to be almost identical, this time we’ll focus on how seemingly minor changes to function signatures can have major impacts on performance.
Overview
Since we already covered how to record performance profiles in the last post, we’ll skip it here. Instead we’ll go directly to a high-level picture of Seb’s read path, and then look at a profile of the code (at 19a5bde1).
A high-level overview of Seb’s read path:
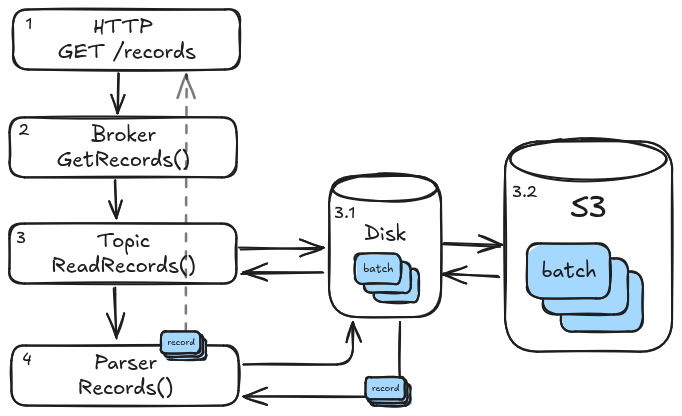
Here, we see that the read path starts with an incoming HTTP request which is handled by an HTTP handler (1) and sent to the Broker (2). The Broker ensures that a relevant instance of Topic exists and hands it the request (3). The Topic then checks to see if the requested records are available in the locally cached batches (3.1), fetching any missing batches from S3 (3.2) and caching them on disk. The Topic then finally uses the Parser to extract the requested records (4), which might span one or more files in the cache. Finally it sends the retrieved records all the way back up the stack, where the result is turned back into an HTTP response and sent back over the network to the caller.
It’s important to mention here that, just like was the case on the write path, the HTTP response is encoded using multipart form-data with one part per record. As was evident when we looked at the write path, this is highly inefficient. To give you an intuition of what multipart form-data looks like, here’s an example HTTP request:
POST /records HTTP/1.1
Host: localhost:51313
Content-Type: multipart/form-data;boundary="boundary"

--boundary
Content-Disposition: form-data; name="0"

record-0-data
--boundary
Content-Disposition: form-data; name="1"

record-1-data
--boundary--
Profiling
Like we did in the last post, we’ll use Go’s excellent profiling tools to identify where Seb is spending its time on the CPU. In order to do this, we need to put some load on the system. The first task of this project therefore was to implement a simple read benchmark that is easy to run. I won’t go into details of the implementation here, but I will note that having a tool to generate reliable, consistent load on your system makes performance optimizations so much easier to do, and gives us much better odds of making actual improvements. I highly recommend investing the time in building a tool like this for your next project!
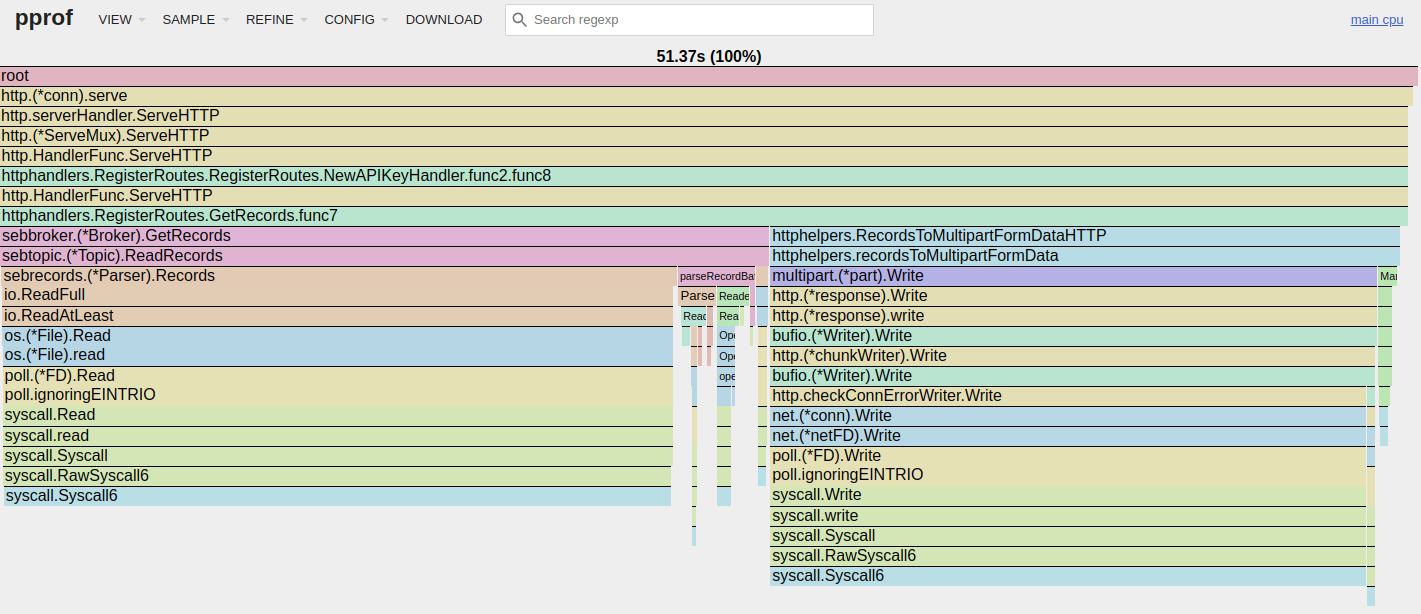
While using the read benchmark to put some load on the system, I recorded a profile of Seb which resulted in the following flame graph:
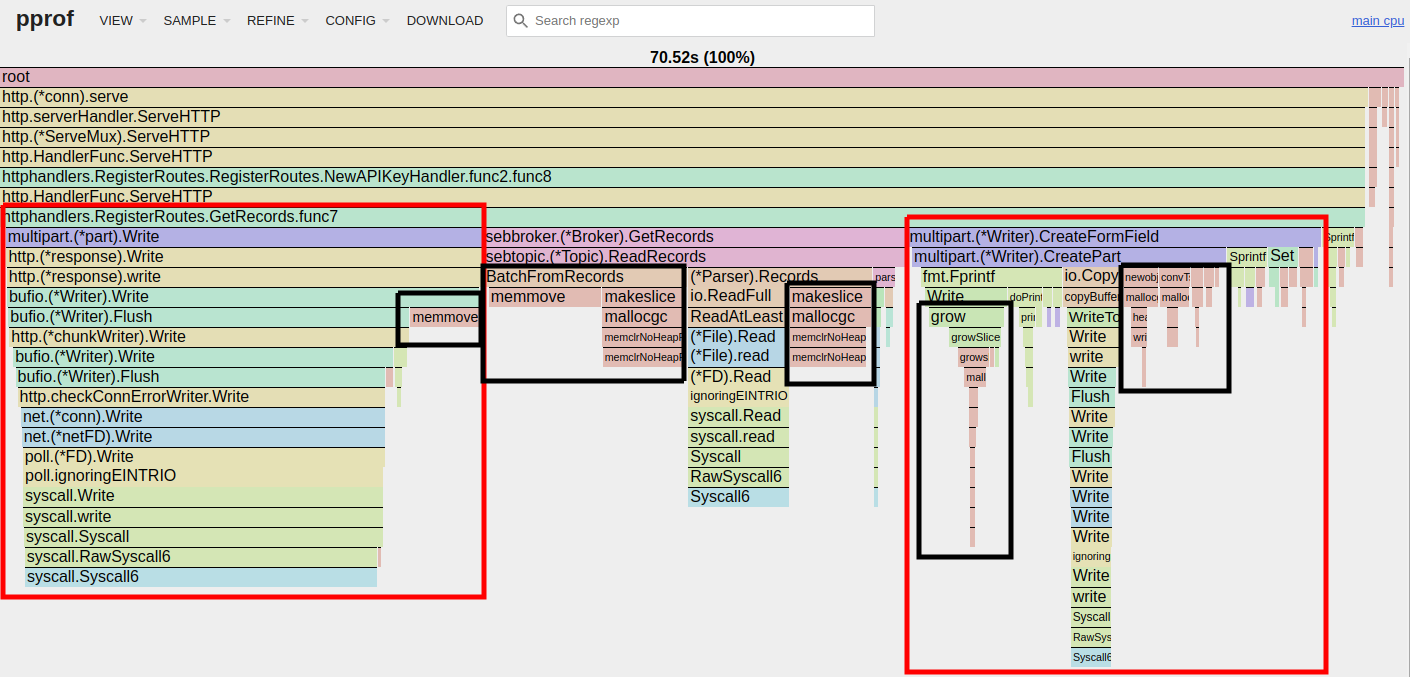
I’ve highlighted multipart form-data formatting-related code using red boxes, and memory-related operations (allocations, copying, and garbage collection) using black boxes. We saw exactly this behavior on the write path in the last post as well, so if you read that one this result should come as no surprise. What we’re seeing is that we’re spending loads of time writing all of the records according to the multipart form-data format, generating a lot of garbage while doing so.
Looking at the left-most red box on the flame graph, we see that most of its time is spent in Syscall6. Going a bit up the stack, we see that this originates from net.(*conn).Write, i.e. writing bytes to a network socket. We want to get a response to our callers, so this work looks productive and isn’t something we’re trying to eliminate.
Looking at the right-most red box, we see that multipart.(*Writer).CreateFormField spends a lot of time serializing our HTTP payload using fmt.Fprintf and fmt.Sprintf, both of which causes a lot of allocations and creates tons of work for the garbage collector.
Lastly, looking at the black boxes in the middle of the flame graph, we see that sebtopic.(*Topic).ReadRecords spends a lot of time allocating and copying bytes around. If you look carefully, you can see that (*Parser).Records does disk IO. And, oh my, although disk IOs are one of the most expensive operations we can do, they take up only ~25% of the the time spent in that function!
Now that we have a better understanding of where Seb is spending its precious time on the CPU, we can focus on how to improve it for the better.
Reflecting
Like we learned in the previous post, data serialization has a major impact on performance. It not only takes time to translate data between formats, it also requires us to allocate and copy bytes between buffers, creating a lot of garbage that has to be cleaned up.
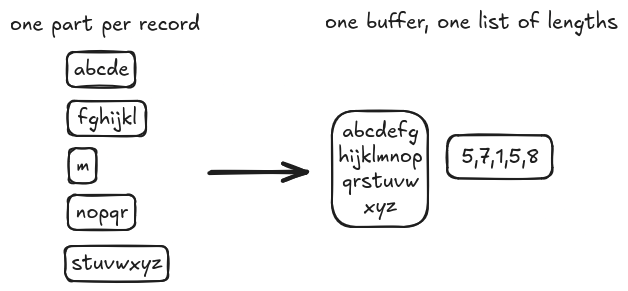
In the previous post we worked backwards from Seb’s internal on-disk format and redefined the user-facing API such that it uses the same format, thereby avoiding almost all of the serialization-related work we’re now seeing on the read path. Instead of using multipart form-data, encoding one field per record, if we instead serialize it as one buffer containing all record data and one list containing the lengths of each record in that buffer, we can avoid a lot of work.
I’ve visualized the difference between the two formats below:
Looking at the flame graph again, what would it look like if we removed all of the serialization and unproductive allocations that we currently see?
Assuming that we don’t have to restructure data but can basically just give the caller the raw bytes, we can just read it from disk and pass it up the stack. This should remove all of the unproductive allocations we saw.
Since the format shown above only requires us to create two form fields instead of N (one per record), we would also expect the time spent in CreateFormField to almost go away.
I’ve visualized what these changes might look like, with blue boxes representing avoidable work:
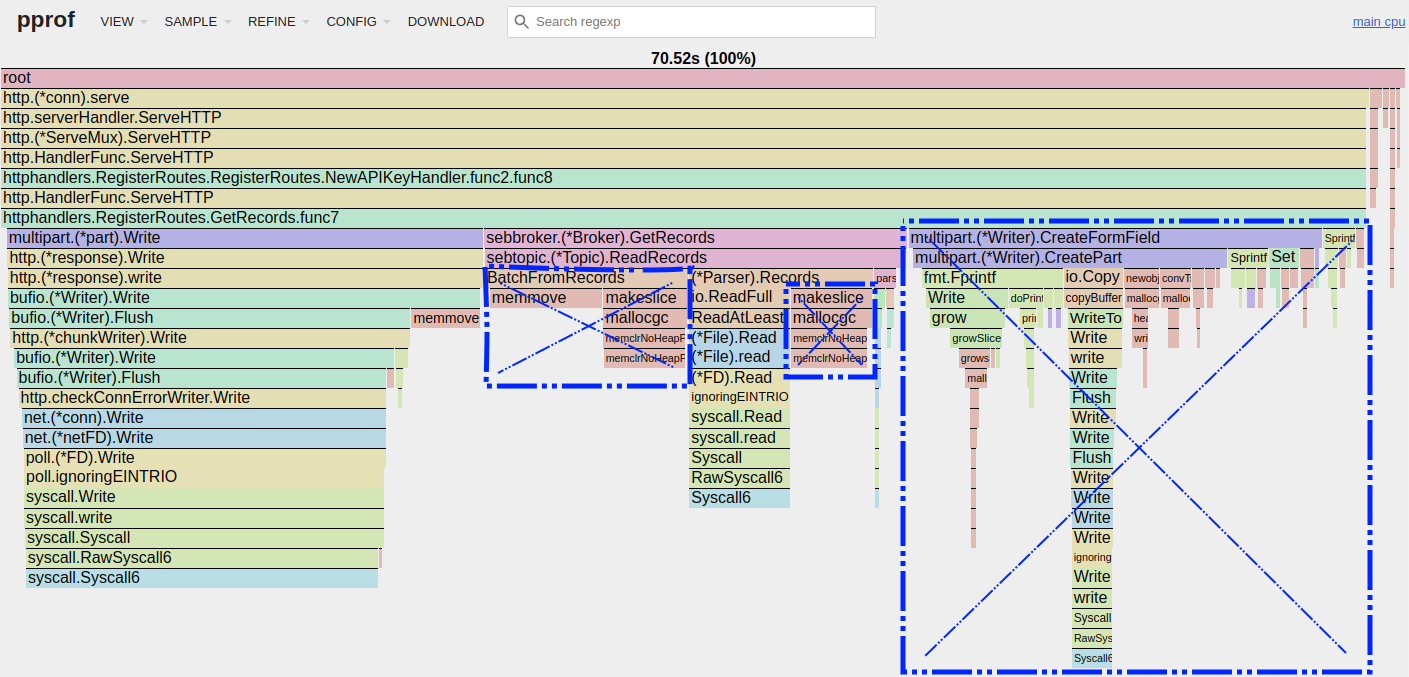
When we disregard the contents of the blue boxes in the above flame graph, we see that we’re almost left with only the essential (and most expensive!) operations: reading from disk and writing to the network.
This is all well and good in theory, but how do we achieve this in code?
Fixing
Although the specific changes in implementation could be interesting to look at, we will continue to look at this using only the high-level information we already know; I want to highlight that the changes in execution speed we’re going to see from the changes described here don’t have as much to do with the exact implementation as it has to do with the structure; the flow of data. Both of course play a role, but I think the most important learnings in this case can be had by focusing on just the structure.
If you’re interested in digging into implementation details, I suggest you look at the source: this is where we start, this is where we end.
In the first diagram of this post, we saw the functions that make up the read path. Here, we see it again, this time with function signatures:
type Batch struct {
	Sizes []uint32
	Data  []byte
}

func (s *Broker) GetRecords(ctx context.Context, topicName string, offset uint64, maxRecords int, softMaxBytes int) ([][]byte, error)

func (s *Topic) ReadRecords(ctx context.Context, offset uint64, maxRecords int, softMaxBytes int) (sebrecords.Batch, error)

func (rb *Parser) Records(recordIndexStart uint32, recordIndexEnd uint32) (Batch, error)
At the bottom of the read path, we see that Parser.Records() returns a Batch. Since this is at the bottom of the call hierarchy, the returned Batches must be allocated within Parser.Records() itself. From the description at the beginning of the post, we know that Topic.ReadRecords() will call Parser.Records() once per file that we need to read. This means that, with the current function signature, we will see at least one allocation per file read. Depending on the number of records requested, this could cause many allocations.
We are looking to eliminate unproductive allocations, so how do we avoid the current requirement that Parser.Records() must allocate a Batch per call? By giving *Batch as an argument instead of requiring it as a return value:
func (rb *Parser) Records(batch *Batch, recordIndexStart uint32, recordIndexEnd uint32) error
The small change we just made to the signature has a very important impact: we moved the responsibility of allocating Batch one level up the stack, from Parser.Records() to Topic.ReadRecords(). We can of course do this same trick all the way up the stack, which changes all signatures to the following:
func (s *Broker) GetRecords(ctx context.Context, batch *sebrecords.Batch, topicName string, offset uint64, maxRecords int, softMaxBytes int) error

func (s *Topic) ReadRecords(ctx context.Context, batch *sebrecords.Batch, offset uint64, maxRecords int, softMaxBytes int) error

func (rb *Parser) Records(batch *Batch, recordIndexStart uint32, recordIndexEnd uint32) error
This minor change has moved the responsibility of allocating Batches from the bottom of the stack to the top. It’s now the responsibility of the code that calls Broker.GetRecords() (in our case an HTTP handler) to provide a pre-allocated batch to be used for each request. As long as the given *Batch is large enough to satisfy the request, we can now guarantee at most one Batch allocation per request, regardless of how many files we need to read data from. And, with allocations being made at the top of the call stack, it’s possible to reuse buffers across requests, leading to even fewer allocations.
To show you what this could look like from the caller’s perspective, here’s a simplified version of the HTTP handler:
type RecordsGetter interface {
	GetRecords(ctx context.Context, batch *sebrecords.Batch, topicName string, offset uint64, maxRecords int, softMaxBytes int) error
}

func GetRecords(log logger.Logger, batchPool *syncy.Pool[*sebrecords.Batch], rg RecordsGetter) http.HandlerFunc {
	return func(w http.ResponseWriter, r *http.Request) {
		// do http stuff

		batch := batchPool.Get()
		defer batchPool.Put(batch)

		err := rg.GetRecords(r.Context(), batch, topicName, offset, maxRecords, softMaxBytes)
		if err != nil {
			// handle various errors
		}

		err = httphelpers.RecordsToMultipartFormDataHTTP(mw, batch.Sizes, batch.Data)
		if err != nil {
			// handle various errors
		}
	}
}
Since the write path already uses the same structure, these changes also allow us to share the pool of Batches between the read- and write paths!
Additionally, since Seb limits how many HTTP requests it wants to handle in parallel, an extra benefit is that it’s now possible to allocate all buffers that the program needs at startup! This of course comes with some drawbacks, e.g. it puts hard limits on the size of payloads, but it also comes with some superhero-like benefits: with all buffers allocated at startup, we can now determine at deployment time how much memory the application will use1. If the application starts at deployment, we can be confident that it cannot go out-of-memory! This sounds surreal and is an absolute superpower when doing server planning and provisioning. This one took a few days to sink in for me, but once I realized the power of it, I couldn’t stop thinking about it. Why aren’t we aiming to build our systems like this?
Alright. With the above changes implemented, it’s time to put some pressure on the system and record another profile. The new recording resulted in the following flame graph:
Oh my, this is even better than I dared hope for! We’ve eliminated basically all of the serialization and garbage collection overhead, even removing a large memmove in multipart.(*part).Write that I wasn’t expecting to get rid of.
On the new flame graph we see that we’re almost literally down to spending time only in Syscall6. Clicking around, I can tell you that the flame graph reports that Syscall6 now takes up 91.9% of the total runtime! Approximately half of it is for reading from disk, and the other half is for writing to the network.
With these very promising changes it’s time to benchmark.
Benchmarking digression
Before jumping to benchmarking, I want to digress slightly and note something I’ve learned the hard way (many times by now, so maybe I never really learned it…)
When benchmarking you should always record and safely store your benchmark parameters. And, importantly, include the version of the code that was used! This lets you know exactly which code and configuration gave you the results you’re looking at. This is incredibly valuable when you inevitably make more changes to the code than you expected, as it allows you to understand how (or even if) you can sensibly compare different runs of the benchmarks. If you fail to do this, you’re destined to have to re-run all of your benchmarks just this last time (for the 7th time.) The best strategy I found for remembering to do this is to just dump the benchmark’s parameters along with the results. The parameters are honestly just as important and valuable as the results themselves!
Benchmarking
The benchmarks run for this post were run on my laptop, a Lenovo T14, plugged in to the wall, with the following specs:
- AMD Ryzen 7 PRO 4750U
- Micron MTFDHBA512TDV 512GB NVMe drive
- 48 gigs of RAM
- Ubuntu 22.04
We’re doing no network requests (all files are cached locally), so the NIC should be irrelevant. Also, since we’re doing buffered IO on a 1GiB records, we expect reads to be mostly served from the page cache.
The benchmarks were run with the following command:
seb benchmark-read --local-broker=true -r 5 -w 16 --batches=4096 --record-size=1024 --records-per-batch=256 --records-per-request=1024 --requests 20000
This command runs 5 repetitions of a job that utilizes 16 workers to send a total of 20.000 requests. Each request asks for 1024 records (1KiB each, so 1MiB/request), for a total of ~19.5GiB requested. The starting offset for each request is selected uniformly at random from a set of pre-inserted and cached records. The on-disk batch size is 256 records/file, so each request will have to open and read 4 or 5 different files.
And, as summarized by the benchmark tool:
Benchmark config:
Num workers:            16
Num requests:           20000
Records/request:        1024
Record size:            1KiB (1024B)
Bytes/request:          1MiB (1048576B)
Total bytes requested:  19.5GiB (20971520000B)
Note: this workload doesn’t really replicate a production scenario where we would probably expect something like a Poisson distribution heavily skewed towards the most recent records. Also, we’re not looking to understand the absolute performance of Seb here but are just looking for the relative impact of our changes.
Without further ado, the results of the benchmarks:
| code | seconds/run | records/second | improvement |
|---|---|---|---|
| reference | 35.82 / 35.32 / 37.21 | 572k / 550k / 580k | - |
| update | 9.76 / 9.50 / 10.30 | 2099k / 1987k / 2154k | 3.67x |
Whoop, a 3.67x improvement; we can now run the same workload in about 1/4 of the time!
For the second time we’re learning that data serialization and unnecessary memory operations have a major impact on performance. By changing the user-facing interface to match the format that Seb wants the data to be in internally, we’ve removed a lot of work and with it a lot of allocations and memcopying. By using simple tools and comparatively small refactorings, we’re seeing a massive 3.67x payoff in performance. Awesome!
Yet again I’ll end my post by tipping my hat giving a big THANK YOU to Joran Dirk Greef at TigerBeetle and Dominik Tornow at Resonate for sharing all of their knowledge and helping to light a fire in the systems software community!
Footnotes
-
this isn’t entirely accurate; I haven’t eliminated all allocations from Seb yet. But the vast majority of memory used is coming from these buffers, so the overall point is still valid. ↩