I’ve been on a bender for the past few weeks. I haven’t been able to stop reading and watching content about TigerBeetle. I was especially enamored by videos in which Joran Dirk Greef presents TigerBeetle in general, replication, and Tiger Style.
Joran has been far and wide the past years, doing all he can to spread the message of TigerBeetle and Tiger Style. Lucky for us, this has left a trail of insightful content in his wake!
My time in the virtual company of Joran has inspired me to try TigerBeetle’s coding style, Tiger Style. Since I’m already working on Seb, my event broker which I want to be fast and keep my data safe, I thought this would be a good place to try it out.
With inspiration from Joran and Tiger Style, my past weekend’s project was to improve the write path of Seb. My goal was simple: write more records per second while maintaining correctness (duh!)
Tiger Style
The parts of Tiger Style that mostly inspired this weekend project were:
Perform back-of-the-envelope sketches with respect to the four resources (network, disk, memory, CPU) and their two main characteristics (bandwidth, latency). Sketches are cheap. Use sketches to be “roughly right” and land within 90% of the global maximum.
Amortize network, disk, memory and CPU costs by batching accesses.
These were particularly intriguing to me since, in the first implementation of Seb, records could only be added and retrieved one-by-one. This was a fundamental, architectural problem that had to change in order for the event broker to have any reasonable hope of not remaining the slowest kid in class forever. In my first post, Hello World, Simple Event Broker, I showed that my first naive batching implementation gave an easy 2x improvement in the number of records handled per second, going from ~22k to ~50k. This was obviously a welcome improvement, but honestly not very impressive.
I’ve been focusing more on correctness than performance while building Seb so far, so I haven’t really taken the opportunity to do any profiling. Until now!
Profiling
It has taken me much longer to learn this than is reasonable, but I now finally know, and act as if I know!, that the very first thing you must do when trying to make your program faster is to measure it and be very systematic about your measurements. Yes, I know it is much more fun to guess at the problem and try out random solutions, crossing your fingers in the hope that one of your guesses magically make things go brrr. But if you plan to make progress instead of trying your luck all day, going straight to some sort of profiling is the winning move. Every. Single. Time. Even if you’re just printf’ing timestamps; you must measure!
Luckily, Go has some excellent tooling for profiling which makes the decision to stop spinning the roulette that much easier. It’s almost trivial to instrument a Go program to be profiled: just start an HTTP server on an unused port (on localhost!) and request a CPU profile from it:
curl http://localhost:5000/debug/pprof/profile?seconds=10 > profile
Once you’ve got your profile, you can view it using:
go tool pprof --http ":8001" profile
This should open up a browser with an interactive view of the profile you just made. If you haven’t done this before, try it out on one of your programs. As the following will show you, you might be surprised by what you find!
Alright, on to Seb. On Saturday morning I fired up Seb, ran a workload with a bunch of inserts and requested a CPU profile.
With the profile in hand, I opened the interactive web view and jumped directly to the flame graph. If you haven’t seen one of these before, check out this explanation.
The graph I got was this (sorry - open the screenshot in a new tab, it doesn’t show in a readable size on my blog and I’m an idiot with CSS):
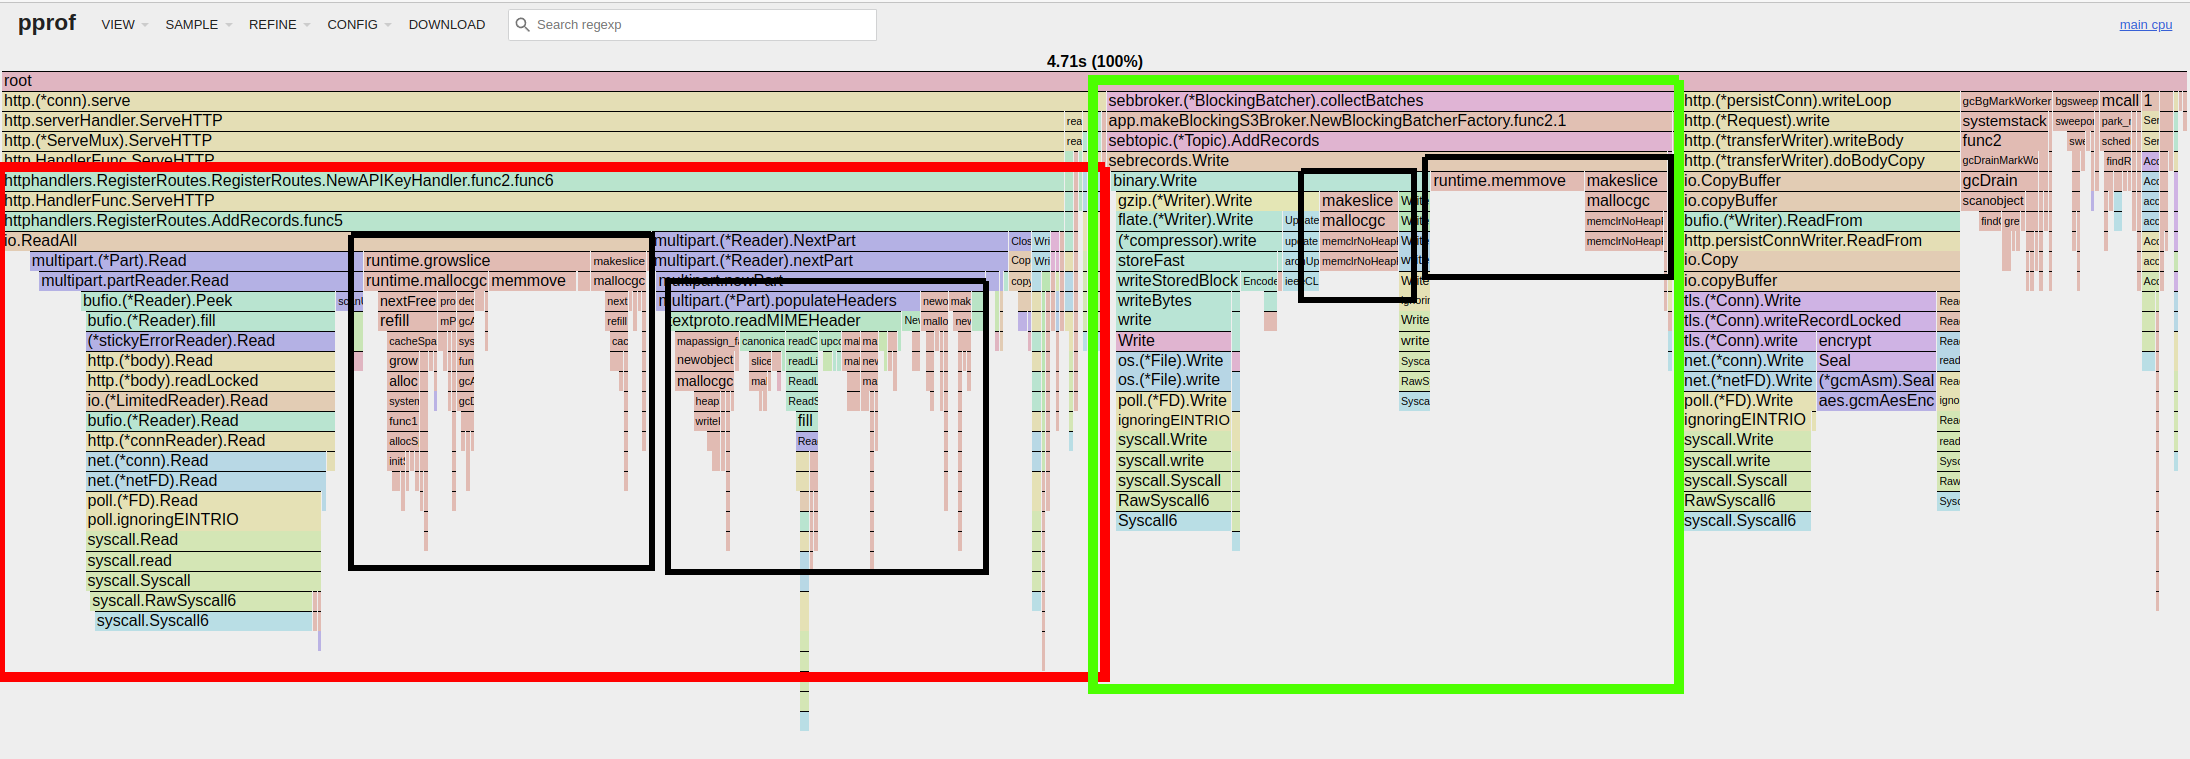
The red box I put on there outlines the HTTP handler httphandlers.AddRecords() which takes up almost 50%(!) of the time of the time shown on the graph. AddRecords()’s job is to parse incoming HTTP requests, pass them to the Broker, and send an HTTP response to the caller. Admittedly I was surprised to see that Seb is spending around half of the time on its write path parsing multipart data and, in the process, generating heaps of garbage that has to be cleaned up again.
The green box on the screenshot outlines sebrecords.Write() which is responsible for writing data to the underlying storage.
The black boxes outline runtime memory operations: allocations, memcopies, and garbage collection. This is a large part of the time spent!
The flame graph basically tells us that Seb is creating a lot of garbage. Like, a lot. Unlike in real life where making a mess can be quite fun, on the computer it’s doubly bad: it’s expensive to clean up and it’s expensive to make a mess in the first place. And, to make matters even worse, using all of this memory completely ruins the effectiveness of our hardware caches. Ugh!
Taking another look at Tiger Style, we see that it has more relevant advice:
All memory must be statically allocated at startup. No memory may be dynamically allocated (or freed and reallocated) after initialization. This avoids unpredictable behavior that can significantly affect performance, and avoids use-after-free. As a second-order effect, it is our experience that this also makes for more efficient, simpler designs that are more performant and easier to maintain and reason about, compared to designs that do not consider all possible memory usage patterns upfront as part of the design.
I have never attempted to implement a system of this size that statically allocates everything, but I appreciate that it must be a major effort to do so. I’m absolutely certain that I won’t remove all allocations from Seb’s write path in this small weekend project, but in terms of performance and safety it seems like great advice. Let’s see how far we get.
Using a stretchy interpretation of the Tiger Style advice of back-of-the-envelope sketching (which is supposed to be done before you actually write your code), let’s have a high-level look at the implementation of the two functions highlighted by the flame graph. Our aim is to find code that puts pressure on the garbage collector.
Investigating
Since AddRecords() is taking up most of the time, we’ll focus on that first. I’ve listed the most relevant code below. The full function is available here if you’re curious. Since the flame graph told us that this function is doing a lot of allocations, I’ve added comments to highlight the most obvious ones.
func AddRecords(log logger.Logger, s RecordsAdder) http.HandlerFunc {
    return func(w http.ResponseWriter, r *http.Request) {
        defer r.Body.Close()

        // ...

        records := make([]sebrecords.Record, 0, 256) // >= 1 ALLOC
        mr := multipart.NewReader(r.Body, mediaParams["boundary"])
        for part, err := mr.NextPart(); err == nil; part, err = mr.NextPart() {
            record, err := io.ReadAll(part)  // >= 1 ALLOC PER LOOP
            if err != nil {
                log.Errorf("reading parts of multipart/form-data: %s", err)
                w.WriteHeader(http.StatusInternalServerError)
                return
            }
            part.Close()
            records = append(records, record)
        }

        // ...
    }
}
We’re only doing a back-of-the-envelope kind of investigation here, so we won’t go into the actual implementations of anything but the code listed above. With just this tiny snippet of code we can tell that there is at least one allocation related to the records variable (notice the trailing “s”), and at least one allocation for the record variable; io.ReadAll() must allocate the byte slice it returns.
Since the record-variable is computed once per N iterations of the loop it looks to be the dominating factor in terms of how many allocations are made. In fancy systems lingo we say that there’s on the order of N allocations happening here - at least one allocation per record received in the HTTP request.
This very high-level understanding of AddRecords() memory usage is enough to satisfy me for now. Let’s turn to the second offender on the list, sebrecords.Write().
func Write(wtr io.Writer, rb []Record) error {
    header := Header{
        MagicBytes:  FileFormatMagicBytes,
        UnixEpochUs: UnixEpochUs(),
        Version:     FileFormatVersion,
        NumRecords:  uint32(len(rb)),
    }

    err := binary.Write(wtr, byteOrder, header)
    if err != nil {
        return fmt.Errorf("writing header: %w", err)
    }

    recordIndexes := make([]uint32, len(rb)) // 1 ALLOC, small
    var recordIndex uint32
        for i, record := range rb {
        recordIndexes[i] = recordIndex
        recordIndex += uint32(len(record))
    }

    err = binary.Write(wtr, byteOrder, recordIndexes)
    if err != nil {
        return fmt.Errorf("writing record indexes %d: %w", recordIndex, err)
    }

    records := make([]byte, 0, recordIndex) // 1 ALLOC, large
    for _, record := range rb {
        records = append(records, record...)
    }

    err = binary.Write(wtr, byteOrder, records)
    if err != nil {
        return fmt.Errorf("writing records length %s: %w", sizey.FormatBytes(len(rb)), err)
    }
    return nil
}
As we saw earlier, the flame graph told us that Write() is spending a lot of time copying things around and doing garbage collection. Looking for big memory accesses, we see that Write() makes two calls to make() - one for recordIndexes and one for records. In preparation of the first loop a single, small allocation is made, before memcopying N uint32s. For the second loop it’s a probably much larger allocation of N*[avg record size] bytes that is being copied into.
We see that both of these allocations are made in preparation of a call to binary.Write(); both are done in order to reduce the number of disk IOs. Calling binary.Write() once instead of N times will reduce the number of disk IO-related syscalls we make. Since Seb is using buffered IO without fsync (S3 is the source of truth!), we can’t tell exactly how many actual disk IOs each call translates to, but at least we do know that it translates to fewer syscalls and context switches.
This means that, although it doesn’t look like it on the flame graph, both of these allocations and memcopies are actually beneficial in the current setting. The cost of doing a memory copy is much smaller than the cost of doing a disk IO, so given the chance to trade between a few memory copies and doing a few disk IOs (or syscalls), you’re very likely to get ahead if you bet on memory copying over disk IOs.
Using Sirupsen’s napkin math and a bit of hand waving regarding buffered IOs, we can estimate that it’s on the order of 10 times faster (100μ/MB vs 1ms/MB) to collect all of our data into a single buffer and then do a single IO instead of doing one IO per record using the fragmented buffers that Write() receives as its input.
Although the flame graph shows that we’re spending a lot of time copying things around in memory, we’ve actually just found that, in this particular example, a bit of memcopy is preferable because it’s done to reduce the number of much more expensive disk IOs.
Fixing
Taking a step back and considering all of the information from our investigation above, we see that the two functions have a common problem: the fact that they’re given records one-by-one impacts how much garbage they generate.
For AddRecords(), each record received directly translates to at least one allocation. Receiving a multipart form data-formatted list of records means that it needs to parse the records and make an allocation for each one. In Write(), we need to transform the slice of records created in AddRecords() into a slice of bytes so that we can write it efficiently to disk.
It looks a lot like we could do the same job with a lot fewer allocations if we simply didn’t have to transform data between different representations!
But how do we do this? If we work our way backwards, we can try to change the interface of Write() so that it doesn’t have to do any transformations:
func Write(recordIndexes []uint32, records []byte) error {
    // ...
}
That doesn’t look too bad! With recordIndexes and records being given directly as inputs, we can write them to disk without further processing.
Working our way backwards up the stack, we can do the same to the callers of AddRecords(). If, instead of requiring users to send data as N multipart form-encoded fields, we request that they send the sizes of each record as one field and the raw record data as another, the number of allocations goes from the order of N to the order of 1, meaning that the number of allocations no longer depends on the number of records in the input. Nice!
With the changes described, the implementation of Write() becomes much simpler and is basically just three calls to binary.Write():
func Write(wtr io.Writer, recordIndexes []uint32, allRecords []byte) error {
    header := Header{
        MagicBytes:  FileFormatMagicBytes,
        UnixEpochUs: UnixEpochUs(),
        Version:     FileFormatVersion,
        NumRecords:  uint32(len(recordSizes)),
    }

    err := binary.Write(wtr, byteOrder, header)
    if err != nil {
        return fmt.Errorf("writing header: %w", err)
    }

    err = binary.Write(wtr, byteOrder, recordIndexes)
    if err != nil {
        return fmt.Errorf("writing record indexes %d: %w", recordIndex, err)
    }

    err = binary.Write(wtr, byteOrder, allRecords)
    if err != nil {
        return fmt.Errorf("writing records length %s: %w", sizey.FormatBytes(len(recordSizes)), err)
    }

    return nil
}
AddRecords() becomes slightly worse to read, but I’m sure another pass could improve it:
func AddRecords(log logger.Logger, s RecordsAdder) http.HandlerFunc {
    return func(w http.ResponseWriter, r *http.Request) {
        defer r.Body.Close()

        // ...

        var fileSizes []uint32
        var records []byte
        mr := multipart.NewReader(r.Body, mediaParams["boundary"])
        for part, err := mr.NextPart(); err == nil; part, err = mr.NextPart() {
            bs, err := io.ReadAll(part)
            if err != nil {
                log.Errorf("reading parts of multipart/form-data: %s", err)
                w.WriteHeader(http.StatusInternalServerError)
                return
            }
            part.Close()

            switch part.FormName() {
            case httphelpers.RecordsMultipartRecordsKey:
                records = bs

            case httphelpers.RecordsMultipartSizesKey:
                err = json.Unmarshal(bs, &fileSizes)
                if err != nil {
                    log.Errorf("reading sizes: %v", err)
                    w.WriteHeader(http.StatusBadRequest)
                    return
                }

            default:
                log.Errorf("unknown field %s", part.FormName())
                w.WriteHeader(http.StatusBadRequest)
                return
            }
        }

        // TODO: we verify that both 'sizes' and 'records' were given

        // ...
    }
}
Let’s see whether our interpretation of Tiger Style back-of-the-envelope changes (and a bit of other make-the-types-match kind of stuff all along the write path that I’ll sweep under the rug for now), has done to decrease the amount of garbage we generate on Seb’s write path:
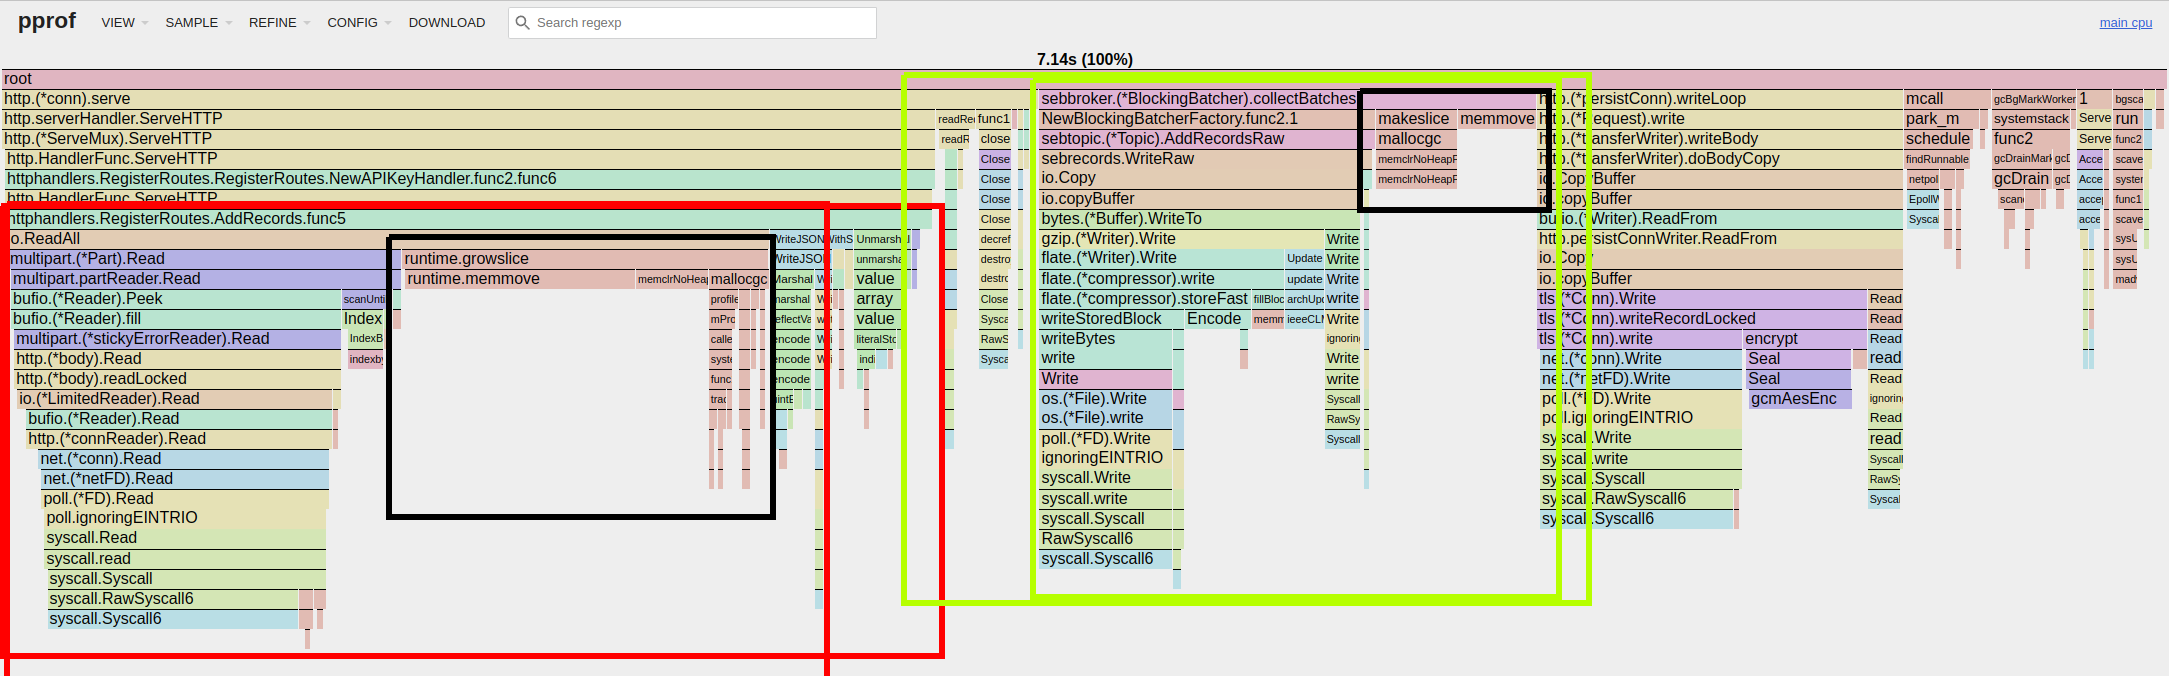
Not bad! AddRecords() has changed quite a bit. What I immediately notice is that half of the multipart parsing code has disappeared from the graph: only the left-most part is still there. It’s not exactly perfect yet, as we’re still spending a lot of time in runtime.growslice. This is likely because each byte slice allocated for the records variable must be expanded quite a few times to accommodate the all of the record data received.
Looking at Write() (which is named WriteRaw() in the new graph), we see that the amount of pressure on the garbage collector has decreased noticeably. You might notice that the allocations have moved from Write() up to its parent, collectBatches() - I’ve swept some minor changes under the rug here, but trust me that this isn’t important to our goal.
Although we’re seeing definite progress, I’m not entirely satisfied with the results of AddRecords() yet. The flame graph is showing us that a lot of time is being spent growing slices, which makes sense since io.ReadAll() is a generic function that starts out with a modest allocation which has to grow to accommodate the size of our batches of records.
In order to fix the problem, we can allocate a pool of larger buffers that can be reused between requests. I’ve highlighted the added lines with comments.
var bufPool = syncy.NewPool(func() *bytes.Buffer { // NEW
 return bytes.NewBuffer(make([]byte, 5*sizey.MB))  // NEW
})                                                 // NEW

func AddRecords(log logger.Logger, s RecordsAdder) http.HandlerFunc {
    return func(w http.ResponseWriter, r *http.Request) {
        defer r.Body.Close()

        // ...

        var fileSizes []uint32
        var records []byte
        mr := multipart.NewReader(r.Body, mediaParams["boundary"])
        for part, err := mr.NextPart(); err == nil; part, err = mr.NextPart() {
            buf := bufPool.Get()        // NEW
            buf.Reset()                 // NEW
            defer bufPool.Put(buf)      // NEW

            _, err = io.Copy(buf, part) // NEW
            if err != nil {
                log.Errorf("reading parts of multipart/form-data: %s", err)
                w.WriteHeader(http.StatusInternalServerError)
                return
            }
            part.Close()

            switch part.FormName() {
            case httphelpers.RecordsMultipartRecordsKey:
                records = buf.Bytes()                         // NEW

            case httphelpers.RecordsMultipartSizesKey:
                err = json.Unmarshal(buf.Bytes(), &fileSizes) // NEW
                if err != nil {
                    log.Errorf("reading sizes: %v", err)
                    w.WriteHeader(http.StatusBadRequest)
                    return
                }

            default:
                log.Errorf("unknown field %s", part.FormName())
                w.WriteHeader(http.StatusBadRequest)
                return
            }
        }

        // TODO: we verify that both 'sizes' and 'records' were given

        // ...
    }
}
Running the same workload again with the new pool of buffers shows that our buffer pool was a great help:
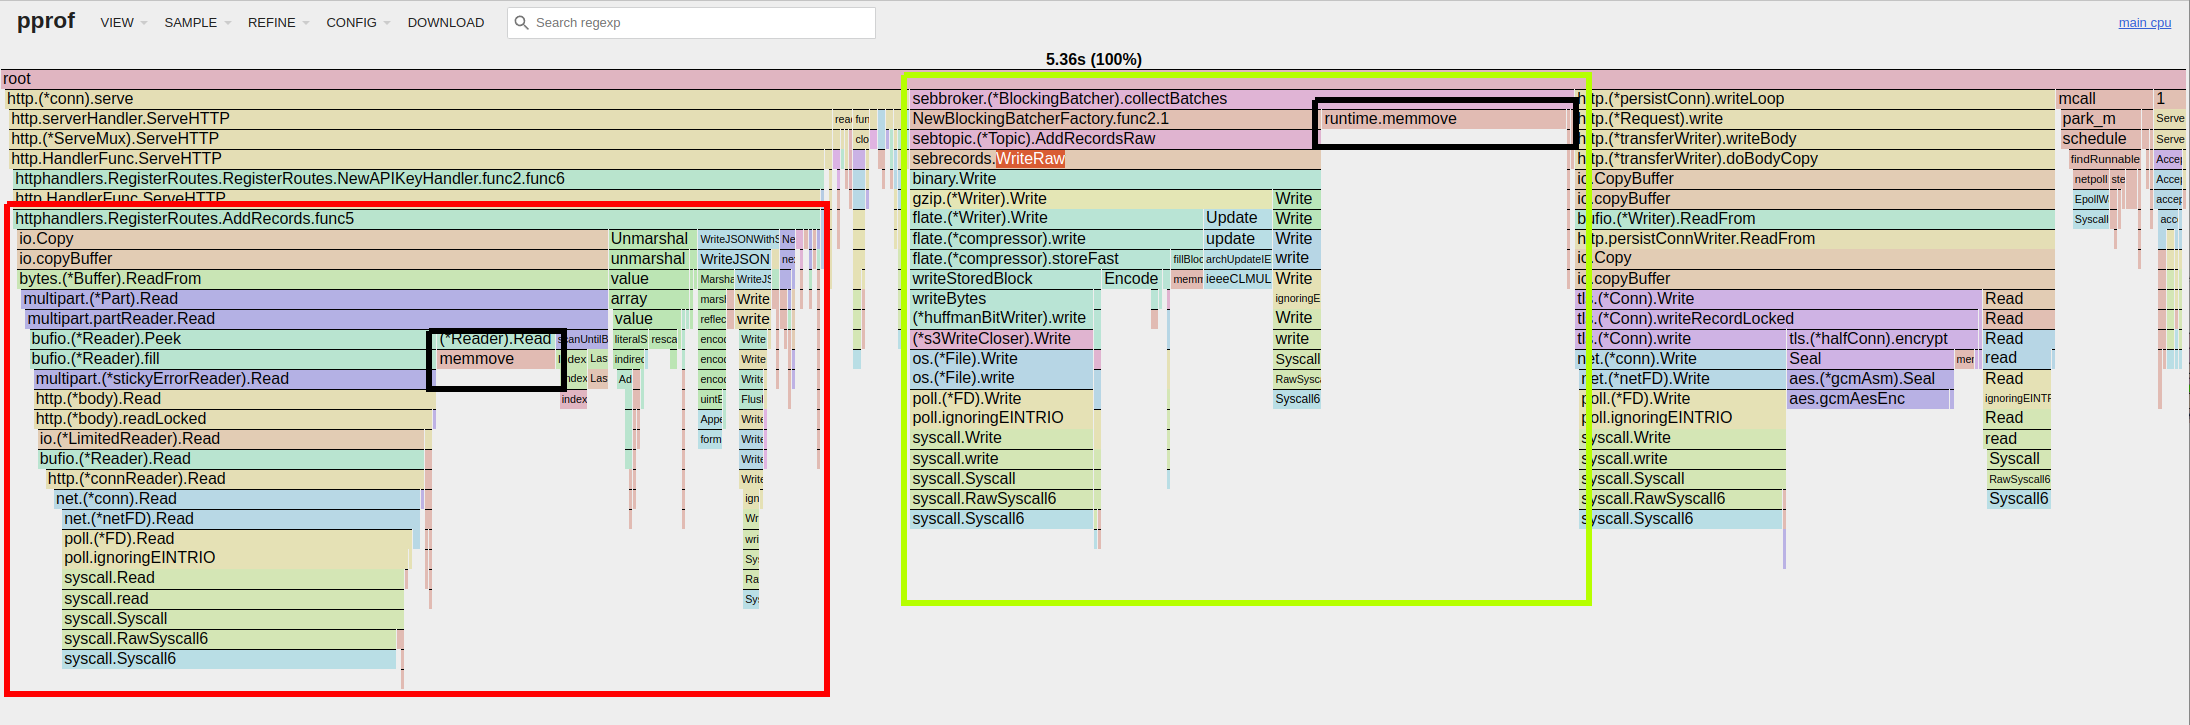
We’re now seeing much less pressure on the garbage collector, with only a few large runtime.memmove() calls left.
This is where we’ll leave the optimization work for now. The only thing left is to do some benchmarking to see how these changes affect the goal of the project, namely increasing the amount of records per second we can push through Seb.
Benchmarking
Part of the work I did during the weekend was to update Seb’s benchmarking tool. It’s nothing fancy, but should work well to get an understanding of the relative improvements of the changes implemented above.
I started out benchmarking using Seb’s S3 storage implementation, but because of very variable latencies I decided that writing to disk would serve us better for these experiments; the purpose isn’t to show how many records Seb can handle in a production scenario, but rather to see relative improvements of the changes discussed above. A final note is that this workload uses buffered IO without fsync, so don’t read too much into the absolute numbers. We’re looking for relative changes, nothing else.
All benchmarks were run on one of Hetzner’s tiny, cheap, 2-core CAX11 machines, and were repeated 10 times each. Each benchmark starts a new Seb broker, exposes it on a local HTTP port and starts 16 goroutines that use the Seb client to pepper the broker with POST /records. They were run like this:
./seb benchmark -r 10 -w 16
The configuration for each benchmark is as follows:
Config:
Num workers:            16
Num batches:            4096
Num records/batch:      1024
Record size:            1KiB (1024B)
Total bytes:            4GiB (4294967296B)
Batch block time:       5ms
Batch bytes max:        10MiB (10485760)
And the results, given as avg / min / max are:
| code | seconds/run | records/second | improvement |
|---|---|---|---|
| reference | 24.21 / 23.37 / 25.11 | 173k / 167k / 179k | - |
| updated, no buffers | 15.82 / 15.51 / 16.13 | 265k / 260k / 270k | 1.53x |
| update, with buffers | 12.41 / 12.17 / 12.57 | 338k / 334k / 345k | 1.95x |
Nice! By running three CPU profiles and looking at Seb’s code at a very high-level, we managed to identify a few locations where we could avoid a bunch of unnecessary memory allocations and thereby alleviate pressure on the garbage collector. These simple changes have almost doubled the number of records that we can push through Seb. Not bad for a weekend project!
With that I’ll say that this has been fun to try out Tiger Style and that I’ll definitely continue learning from it in the future. I’m particularly interested in deterministic testing; if you happen to have great references and/or code examples to study, please let me know!
Thanks to Joran and the TigerBeetle team for sharing their many insights with all of us - it’s a major source of inspiration!
If the post resonated with you and you are looking for someone to help you to do hard things with a computer, you can hire me to help you!